To ensure credibility and transparency, particularly scrutiny regarding its use during accident investigation, PipeTech’s background theory has been published in several top rated rigorously peer reviewed international journals.
The following presents examples of PipeTech’s performance based on comparison with real data.
HYDROCARBON PIPELINES
Figures 1 – 5 show comparison of PipeTech’s performance against the test data obtained by Shell and BP on the Isle of Grain (Richardson and Saville, 1996). The data relate to the full bore rupture of 100 m, 0.154 m ID, LPG pipeline containing ca. 95% Propane and 5% n-Butane at 21.6 bara and 17.8 °C. The ambient temperature, heat transfer coefficient and pipe roughness are 19.1 °C, 100 W/m2K and 0.05 mm respectively.
Figures 1 and 2 respectively show the variations of discharge open end and intact end pressures with time following full bore rupture. Figure 3 & 4 on the other hand respectively show the corresponding variations of the fluid temperatures. Figure 5 shows the variation of the discharge rate with time following full bore rupture.
Figure 6 shows the simulation of intact end pressure vs time data following the full bore rupture of the 117 bara, 54 km long, 0.419 m i.d sub-sea, natural gas line from Piper Alpha to MCP-01 platform during the Piper-Alpha tragedy. The ambient temperature, heat transfer coefficient and pipe roughness are 10 oC, 5 W/m2K and 0.005 mm respectively (Richardson and Saville, 1991). The inventory comprised (molar %); CH4 (73.6), C2H6(13.4), C3H8(7.4), i-C4H10(0.4), n-C4H10(1.0), i-C5H12(0.08), n-C5H12 (0.07), n-C6H14(0.02) and N2 (4.03). Curve A represents the actual data logged during the release, while curve B is the data obtained using PipeTech.
Fig.1 Open end pressure-time profiles for Test P40 following FBR of the LPG pipeline.
Curve A: Field data*
Curve B: PipeTech *
Richardson, S.M., & Saville, G. (1996). Blowdown of LPG pipelines. Trans. IChemE, 74B, 236.
Fig.2 Closed end pressure-time profiles for Test P40 following FBR of the LPG pipeline.
Curve A: Field data*
Curve B: PipeTech *
Fig.3 Open end temperature-time profiles for Test P40 following FBR of the LPG pipeline.
Curve A: Field data*
Curve B: PipeTech *
Fig.4 Closed end temperature-time profiles for Test P40 following FBR of the LPG pipeline.
Curve A: Field data*
Curve B: PipeTech *
Fig.5 Variation of discharge rate with time for Test P40 following FBR of the LPG pipeline.
Curve A: Field data*
Curve B: PipeTech *

Fig.6 Variation of intact end pressure with time following FBR of the subsea line from Piper Alpha to MCP-01 during the Piper Alpha disaster.
Curve A: Recorded data†
Curve B: PipeTech
†Richardson, S. M., and G. Saville, “Blowdown of pipelines,” Society of Petroleum Engineers Europe 91, Paper SPE 23070, Aberdeen, UK, 369 (1991).
CO2 PIPELINES
Figure 7 shows a comparison of PipeTech’s predictions against experimental data following the release of CO2 through various orifice diameters. The experimental data is obtained from the CO2PipeHaz and CO2QUEST FP7 European commission projects.
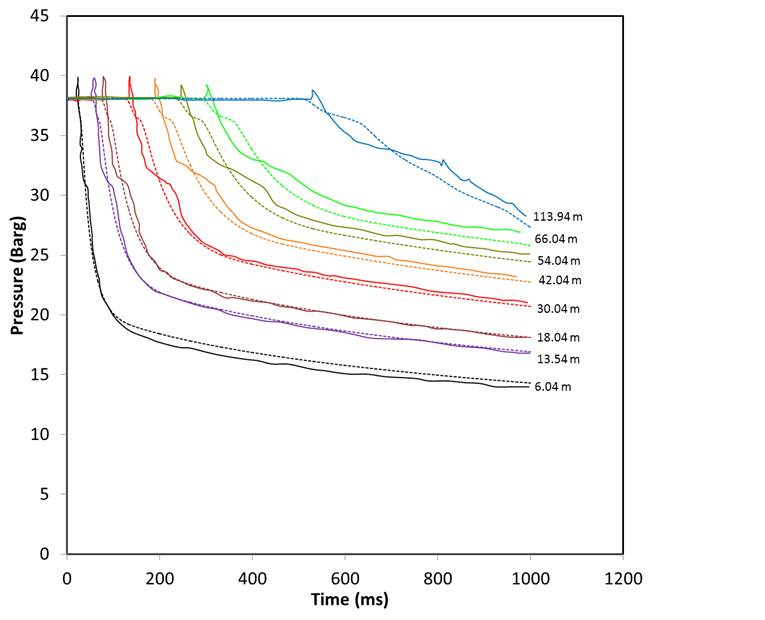
Figure 8 shows comparison of PipeTech’s predictions with experimental data for pressure vs time profiles at various distances along a 134 m long, 0.1648 m CO2 pipe following its full bore rupture.
Fig.7 Comparison of PipeTech predictions against a CO2 discharge rate measurement for various pipeline puncture diameters*.
*Data obtained from CO2PipeHaz FP7 project

Fig.8 Comparison of Pressure vs time profiles at various distances along the CO2 pipeline following its full bore rupture.
Pipeline length = 143 m
Pipeline internal diameter = 0.168 m
Solid line: Measurements (Cosham, A. et al., The decompression behaviour of CO2 in the gas phase, International Forum on the Transportation of CO2 by Pipeline, Newcastle, UK , 22-23 June, 2011)
Dotted line: PipeTech predictions